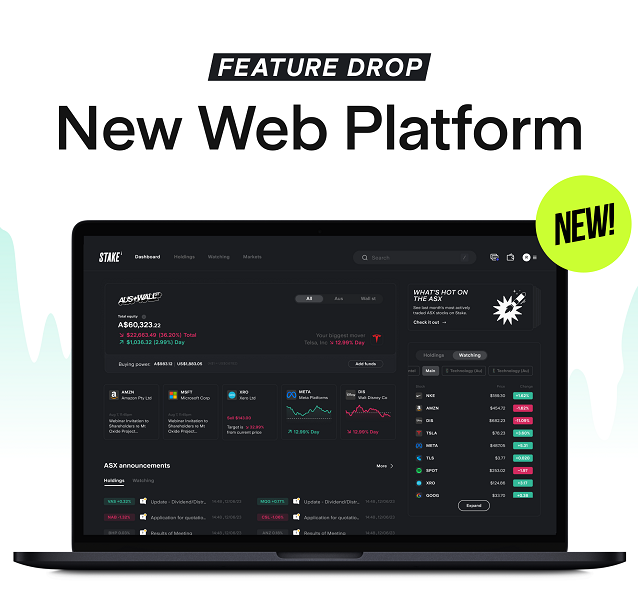
Investment platform Stake launches new web platform with enhanced analysis tools for ambitious investors
Stake, the investment platform connecting ambitious investors with Wall Street, has launched its new web platform, providing better tools and analysis for managing portfolios and making investment decisions.
The product brings significant upgrades, including the ability to plot, buy and sell orders on charts, draw trend lines, track portfolios through a powerful but intuitive dashboard, and assess new investment opportunities.
Joel Larish, Chief Product and Technology Officer at Stake said, “Stake has already broken barriers for ambitious investors through our best in class mobile experience, but as customers continue to grow their portfolios and hone their investing skills, we are now introducing more options to help them build their wealth. The new web platform has powerful features that capitalise on the benefits of desktop screens, while maintaining a streamlined user experience so investors don’t feel overwhelmed.”
The rollout follows Stake’s launch of Extended Hours in December 2023, which gives local investors more than nine extra hours to buy and sell shares on Wall St per trading day. Despite Extended Hours only launching in December, over 20% of all orders on Stake have been made with the features toggled on, as customers use the extra windows to place their orders.
Key features of Stake’s new web platform include:
- Enhanced charting for price action analysis: interactive candlestick and line charts, plus the ability to draw trends with the pen tool, mean investors can better apply technical analysis techniques. Buy and sell orders, plus average buy prices, can be mapped on the chart of each holding to keep track of performance.
- A unified view across the ASX and Wall Street: customers can see balances across their US and Australian portfolios in AUD, making it possible to get a quick view of overall performance.
- Stop and limit orders now available directly from the chart view: orders can be placed directly from the chart of each security, making it simpler to automate trades based on key levels.
- Stock comparison tool: this allows users to instantly analyse two Wall St stocks head to head for performance comparison and analysis.
- Detailed portfolio breakdown: more options to customise dashboards to best suit customers, such as portfolio size per holding, cost basis, and average buy price.
- Analyst ratings: new dashboard displays Wall St analyst ratings plus price targets for newly updated and popular stocks.


