How your broker’s performance numbers mislead you
by Doug Morris, CEO, Sharesight
The human brain is easily conditioned. Do something for long enough and even the strangest things begin to appear normal.
Online brokers don’t set out to deceive but the simplistic way they report performance has a similar, normalising effect. If your returns have been presented in a particular way for long enough, the figures become right even when they’re wrong.

This is a problem for Sharesight as much as it is for the clients of online brokers. Accustomed to seeing the most basic reporting in their account, they load their data into Sharesight and struggle to understand how two sets of figures can be so different.
We’re going to resolve that confusion by explaining the main ways online brokers get performance reporting wrong. Let’s start with a snapshot of the data available in one of my accounts from one of the leading Australian online brokers.
Here’s what the detailed breakdown looks like on their website:
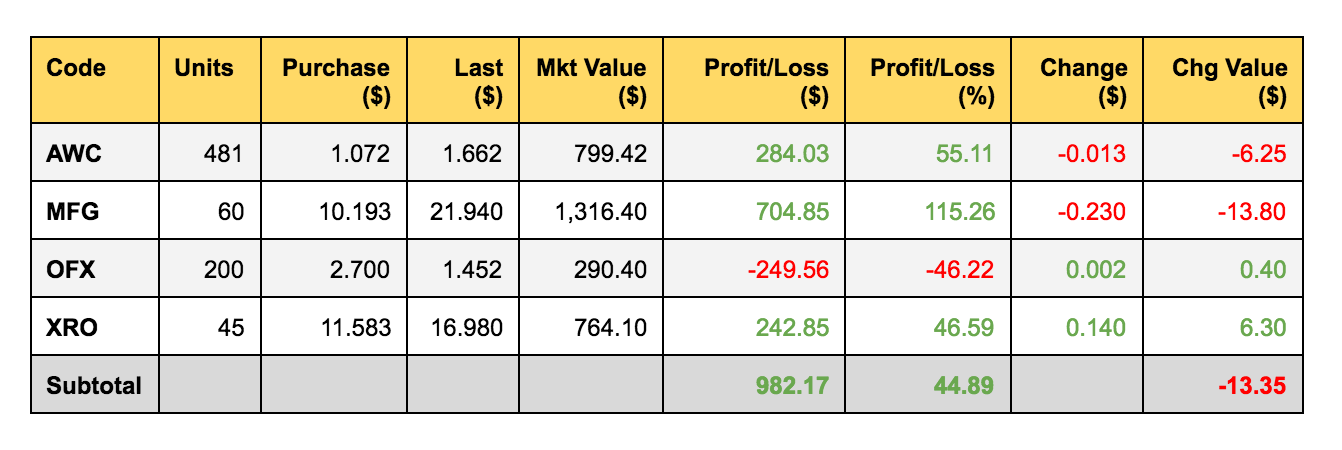
According to the broker the total profit on these four stocks is $982.17, a profit of 44.89%.
Most investors think this is their return. It’s not.
Now here’s what the same portfolio – same purchase date, stocks and quantities but slightly different current prices – looks like in Sharesight:
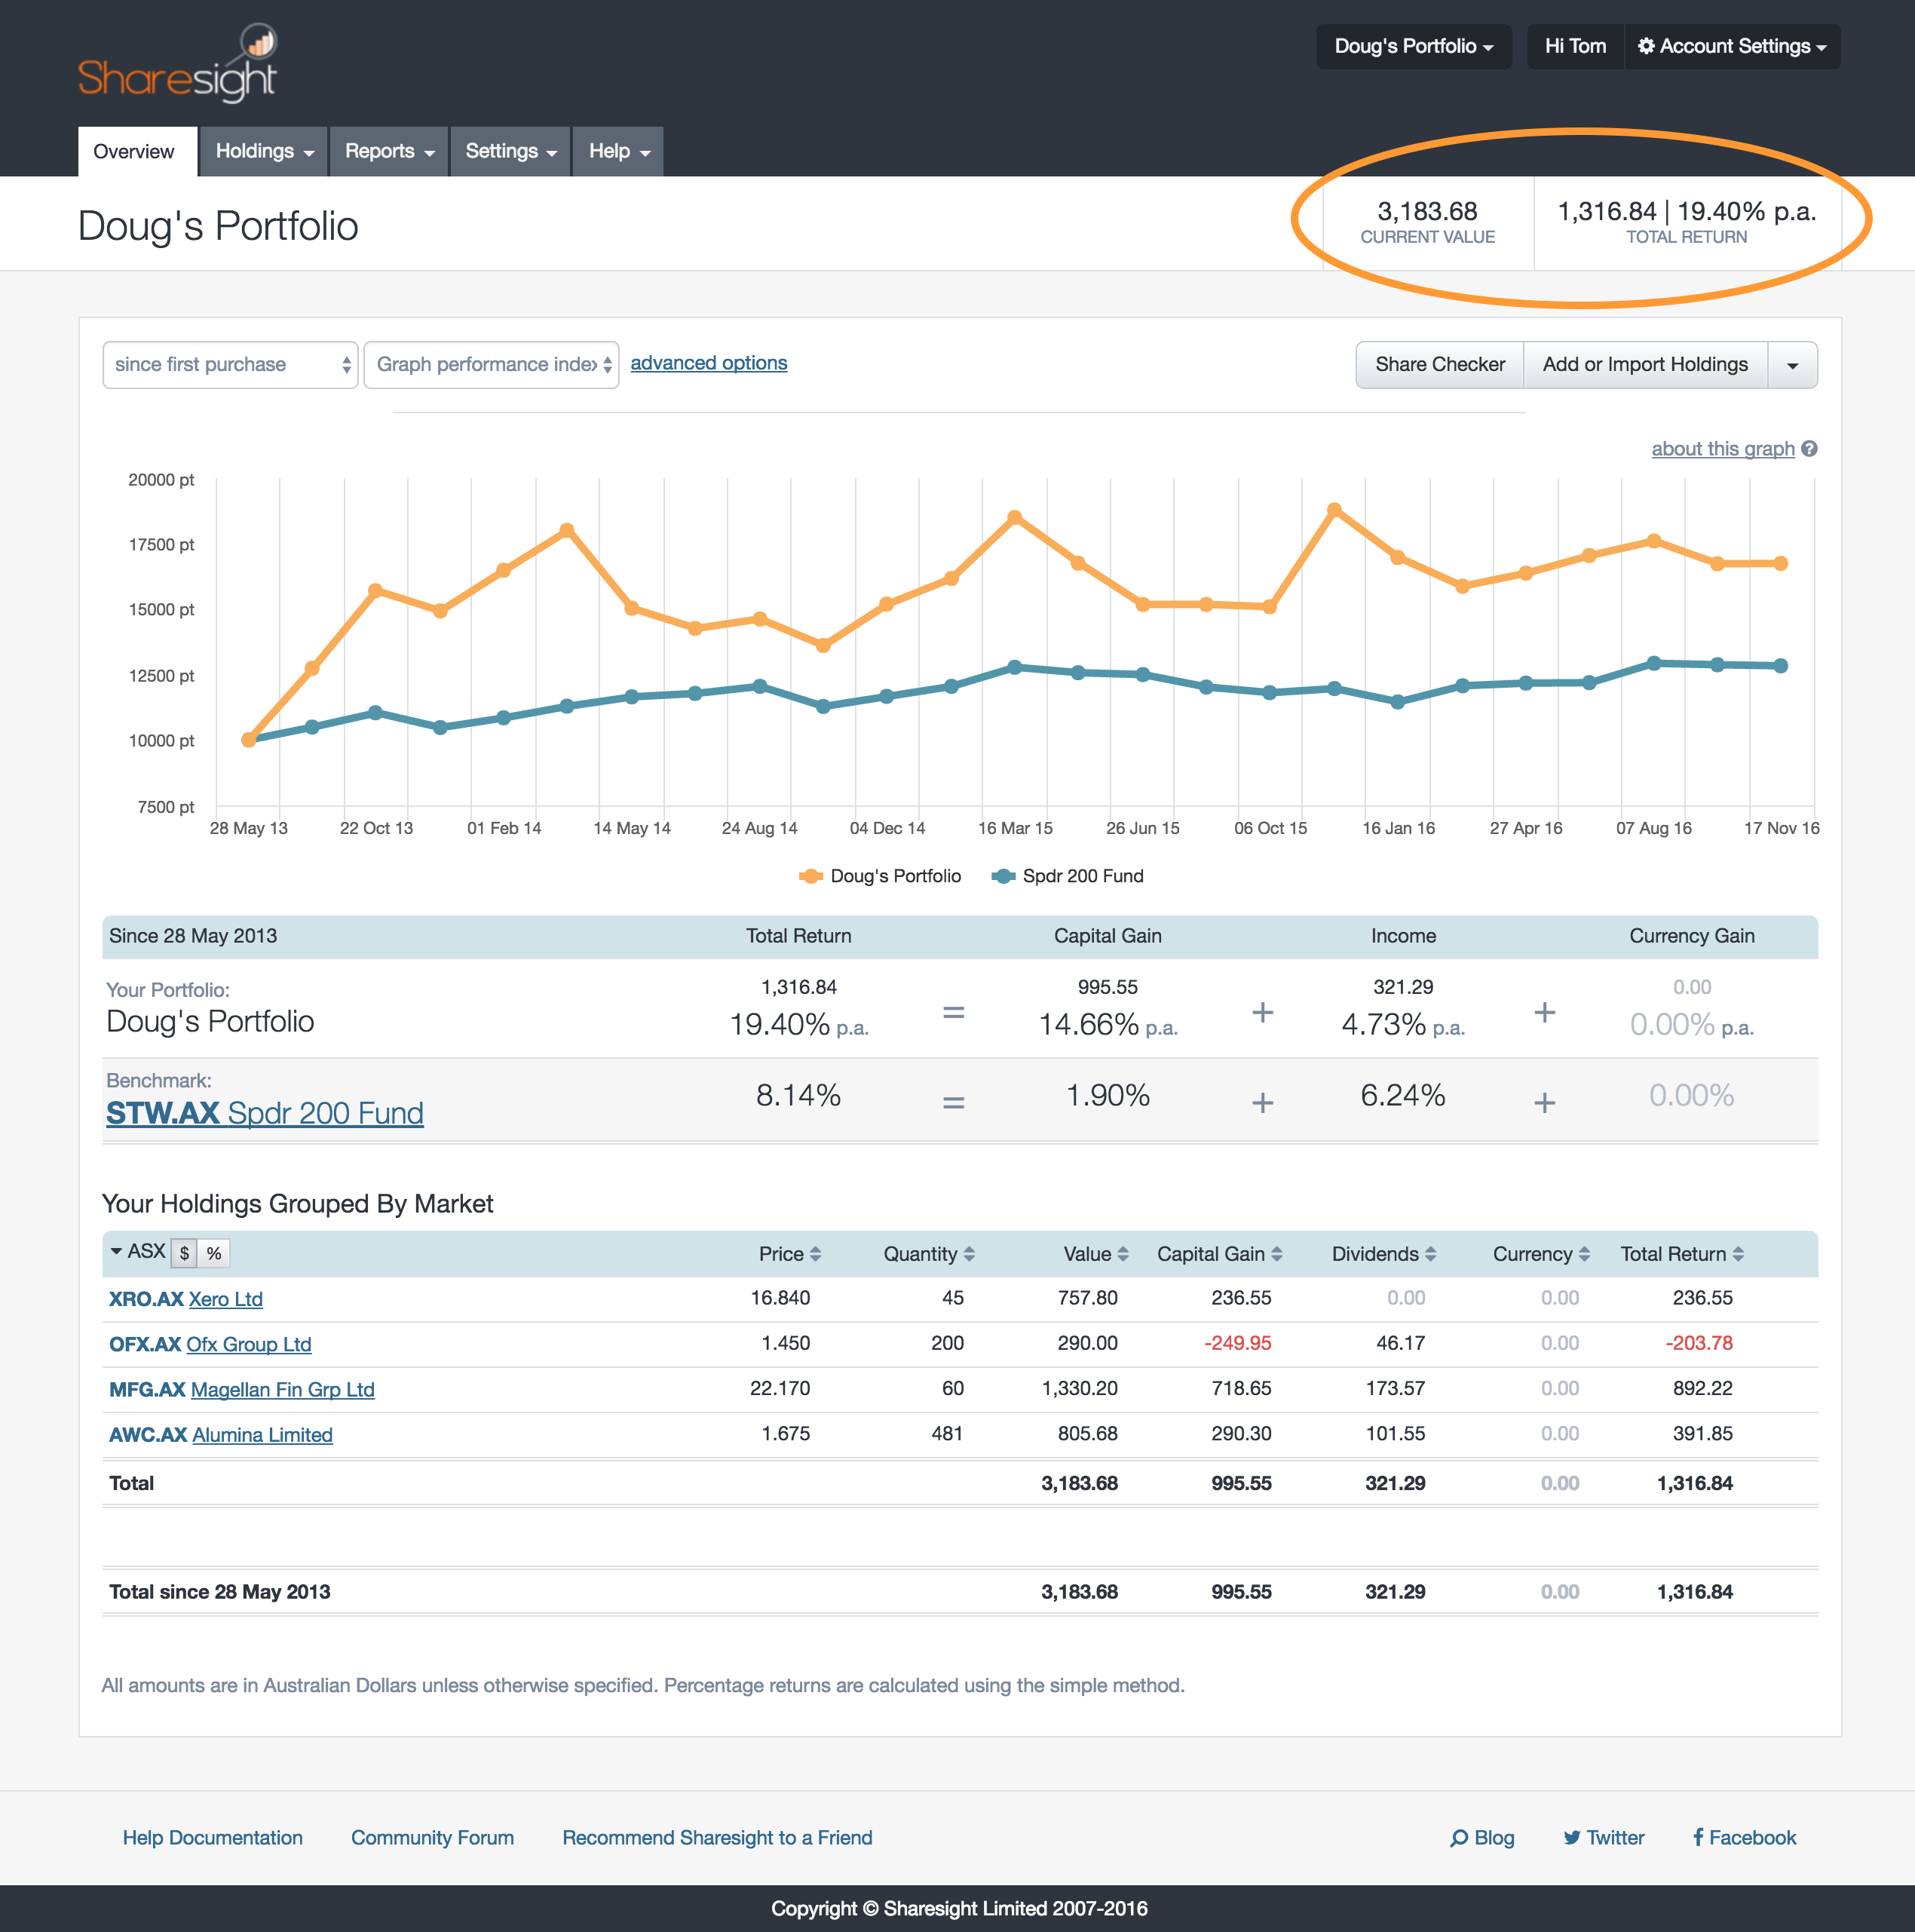
The broker’s $982.17 profit seems like a 44.89% return but the Sharesight profit of $1,316.84 amounts to a return of only 19.40%, less than half the broker’s figure.
The $13.38 difference between the capital gain in Sharesight and the profit on the broker’s website is due to minor difference in closing prices – the broker uses real time data, we use end of day.
For investors that want to understand how well they’re performing compared to a benchmark index or term deposit, this is deeply confusing. How can the broker generate a return more than twice that of Sharesight from an identical portfolio? There are two main reasons.
#1 The broker’s figures don’t include dividends
According to AMP Capital Investors, of the 11.8% p.a. total return from Australian shares since 1900, just over half has been from dividends. And yet the broker’s figures, despite the fact they’re the biggest contributor to long term returns don’t include dividends in the profit and loss figure.
In contrast, Sharesight shows that a total of $321.29 has been paid in dividends (and also includes currency gains and losses for investors with foreign stocks), adding significantly to total returns – and this portfolio isn’t even focussed on dividend yield.
Many investors also use dividend reinvestment plans. Sharesight factors these in automatically, but your broker has no idea whether you’ve opted in to one or not. This throws their figures even more out of whack with reality.
#2 The broker’s figures ignore the holding period
This is another major reason for the broker’s overstatement of returns. There’s a world of difference between a 10% capital gain made over a month and one earned over a decade. As an investor, it’s impossible to know how well you’re performing without having a figure that accurately calculates annual returns.
Brokers perform a very basic calculation, taking the difference between total cost and market value to come up with a profit or loss and percentage change. This calculation takes no account of holding period. Sharesight examines the holding period of each stock you own, annualising any over a year. Using what’s known as a dollar-weighted return Sharesight delivers an accurate calculation of total annualised returns, including dividends, currency variations and the impact of dividend reinvestment plans.
These two factors combine to render the broker’s Profit/Loss percentage utterly useless. A look at Magellan (ASX:MFG), the portfolio’s top performing holding, shows how.
The broker’s table above shows that the Magellan holding turned a profit of $704.85, a 115.26% return. That sounds pretty good, right? (Ignore that ‘Change Value($)’ showing a loss of $13.80. It relates to the change on the previous day’s close – they’re just trying to confuse you). Here are the figures for the same holding from Sharesight:
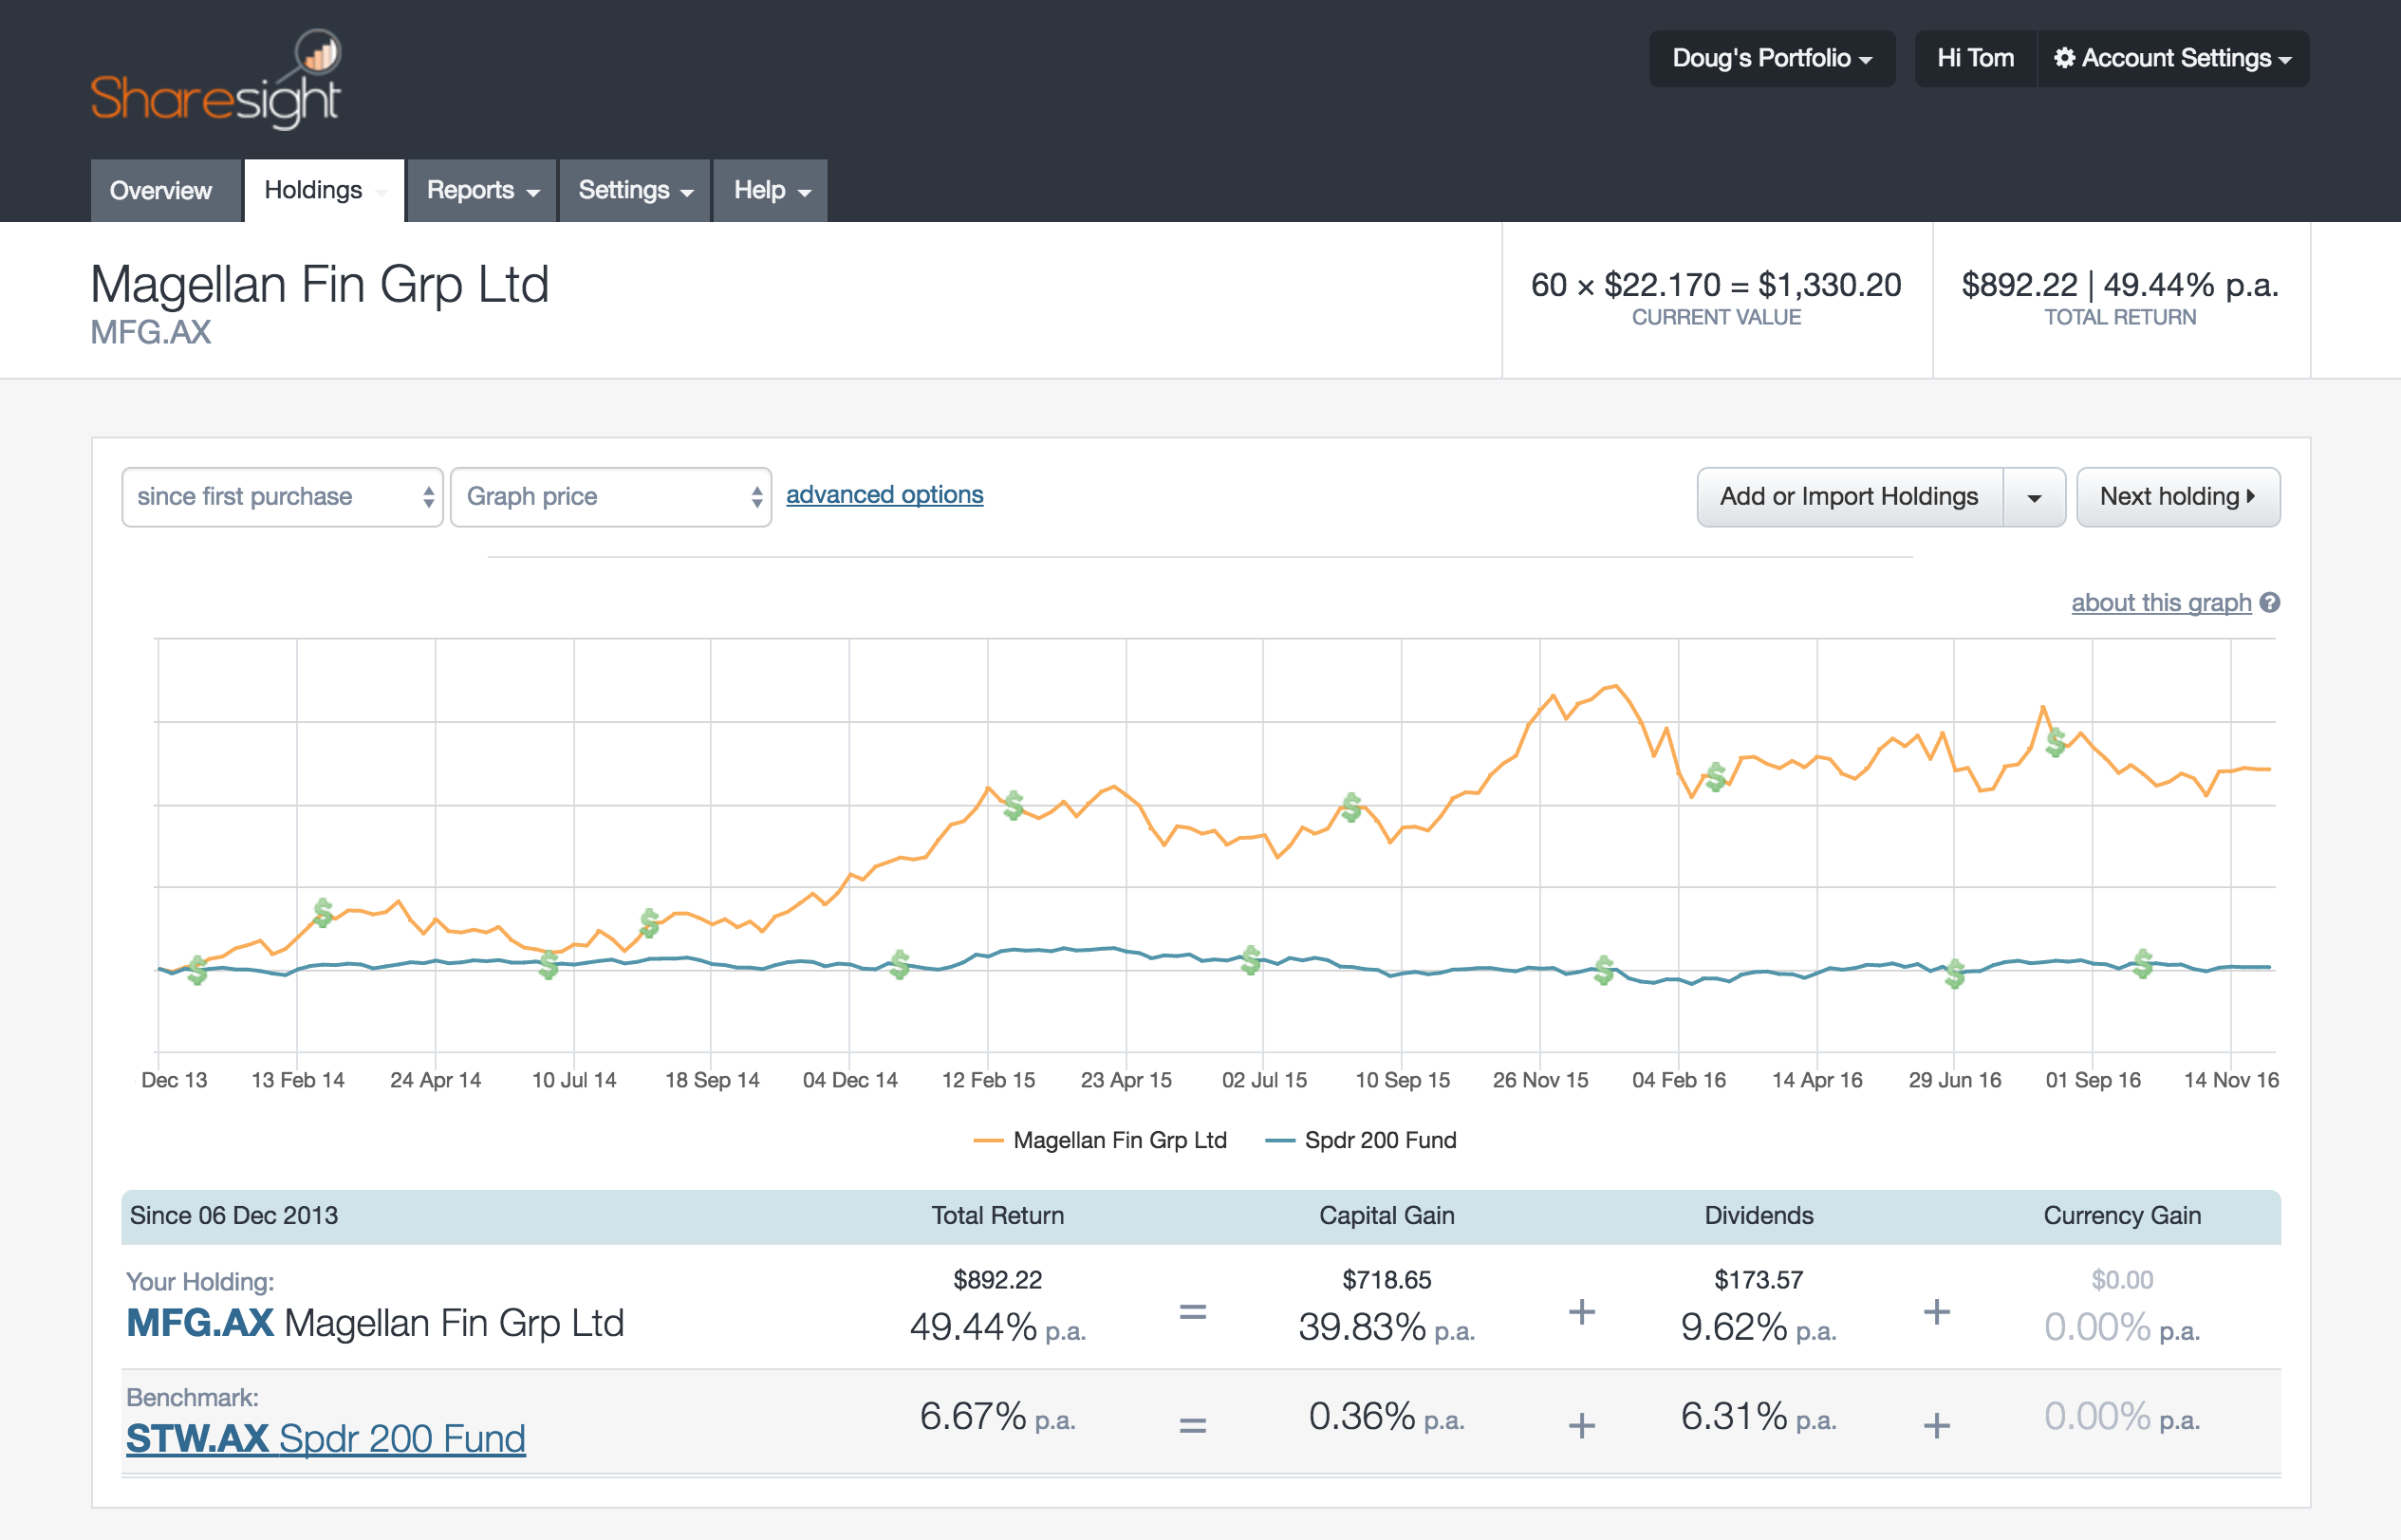
See how your total return is not really 115.26% but an annualised return of 49.44% pa, comprising of 39.83% a year in capital gains and 9.62% a year in dividends? Isn’t that a better way to understand whether you’re beating the market or not?
Imagine how a fund manager would be perceived for promoting a 116% return instead of a return of 8% a year over a 10 year period, despite the fact they’re the same thing? And yet that’s what the broker does.
Reporting returns based on a simple calculation between buy price and latest price, disregarding holding period and dividends, is why the broker’s profit/loss figure is almost twice that of the true figure of 49.44%, arrived at by Sharesight.
There are two additional ways in which brokers’ figures mislead. Some exclude brokerage and other transaction costs from their performance calculations, effectively overstating returns as a result. With Sharesight, the cost of brokerage is automatically stripped from your trade confirmations with each trade and excluded from the total return calculation. Second, when you change brokers the cost base used in the original profit/loss calculation isn’t carried over from one broker to another. This means you’ve lost all data continuity.
So, don’t expect reliable performance reporting from your broker. If you really want to know what your true performance is, across asset classes, accounting for dividends, DRPs, transaction costs and currency movements, Sharesight is the answer. It will even provide reliable tax statements for your accountant.
Best of all, with benchmarking tools and editable charts and graphs, it’s easy to accurately compare and visualise your performance against the index of your choice. With most online brokers you’ll never know whether you’re beating the market or not. With Sharesight you always do.