Market corrections: The importance of portfolio tracking when stocks are down
By Stephanie Stefanovic, Content Manager, Sharesight
The simple cause of a market correction – defined as a market decline of at least 10% from a recent peak – is that investors are more inclined to sell than buy. This is often a reflection of diminishing investor sentiment, which can be induced by anything from political instability to a downtrend in the economy. The problem for investors is that market corrections are like a negative feedback loop; investors sell off their stocks causing prices to drop, which then causes more investors to sell off their stocks, resulting in a race to the bottom.
While watching your portfolio sink into the red may seem like a demoralising experience, savvy long-term investors understand that market corrections are often temporary. They can also represent an opportunity to buy stocks at a “discount”. Most importantly, prepared investors understand the importance of portfolio tracking no matter the market conditions. By using an online portfolio tracker like Sharesight, investors can see the performance of their portfolio at a glance, with access to powerful reporting tools designed to help investors make better decisions.
The 2022 market correction
This year, markets have faced a series of unique challenges, with geopolitical tensions and pandemic aftershocks giving rise to rapidly growing inflation worldwide. While the beginning of the pandemic saw rapid growth in global markets such as the S&P 500 and ASX 200, particularly in the tech sector; two years later, inflation is surging and central banks around the world are raising interest rates, causing investor optimism to dissipate.
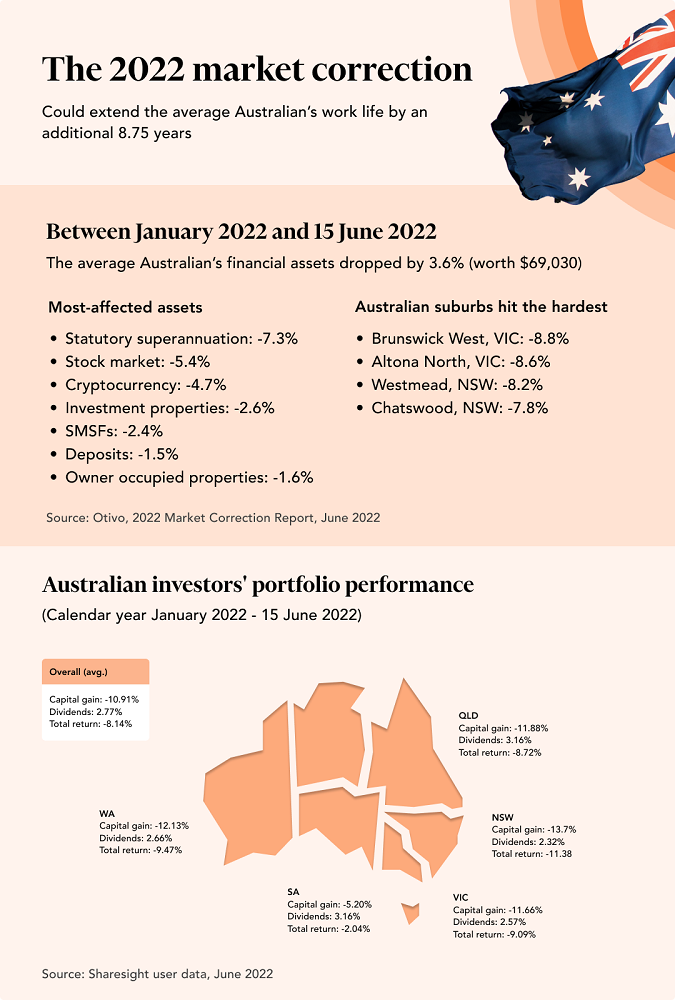
According to research from Otivo, the 2022 market correction could extend the average Australian’s work life by 8.75 years, with Australians’ financial assets declining by 3.6% between the period of 1 January and 15 June. In dollar terms, this is equivalent to almost AU$70,000.
See the infographic below for more details on how Australian asset classes have fared over the period, including how investors’ portfolios performed on a state-by-state basis.

The takeaway
As can be seen from the infographic, investors around the country saw negative total returns during the first 5 months of 2022, with dividends acting as a ‘silver lining’ for falling portfolio values. Falling prices were not unique to the stock market however, with many other asset classes facing losses over the period.
During this period of ongoing volatility, investors who fail to track their assets risk missing out on opportunities to rebalance their portfolios and optimise their financial position for the months ahead. One of the best ways for investors to get the complete picture of their finances is by utilising Otivo’s integration with Sharesight, where investors can get in-depth investment performance data (plus tax reporting) from Sharesight, combined with Otivo’s personalised financial advice, which covers everything from advice on fast-tracking your savings to getting rid of debt and growing your superannuation.


