Investors react to bear market in June as managed funds across all asset types see outflows, except Australia-focused equity funds
Australian investors have turned negative on equities for the first time since the onset of the pandemic, according to the quarterly Fund Flow Index from Calastone, the largest global funds network. Although investors continued to subscribe to managed equity funds in April and May, by June, sentiment had turned sharply negative. June saw them pull A$253 million from their holdings.
Investors were negative on every category of equity fund in June, except Australia
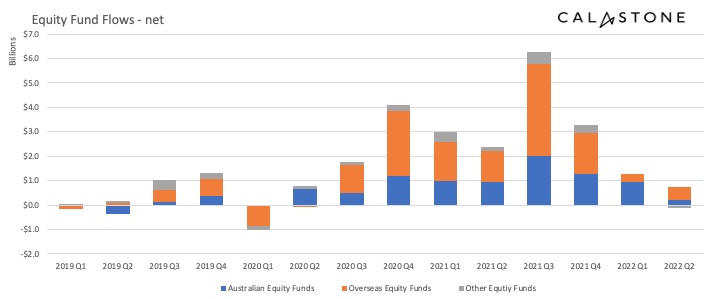
Investors were negative on every category of equity fund in June, except Australian equities. Funds focused on all different regions of the world, sector-focused funds, even ESG, all saw outflows in June. Global funds bore the brunt of the selling, with outflows of A$120 million, while specialist sector funds, which mainly focus on infrastructure assets were also hard hit.
Australian equities were the only category to see inflows in June
By contrast, Australian equities were a beacon of relative stability. Net inflows in June totalled A$36m, though this was around one tenth of the average monthly inflow over the last two years. Over the whole of the second quarter net subscriptions to managed equity funds dwindled to just A$605 million, down from A$1.21 billion in the first quarter and a record A$6.27 billion in the third quarter of 2021. This was the weakest reading since the first quarter of 2020, which saw outflows until concerted policy action by governments and central banks began to support economies and therefore markets as the pandemic spread.
Figure 1: Calastone net fund flows across selected equity categories, all AU domiciled

Across all asset classes, Q2 outflows of A$2.05bn were the largest on Calastone’s FFI record
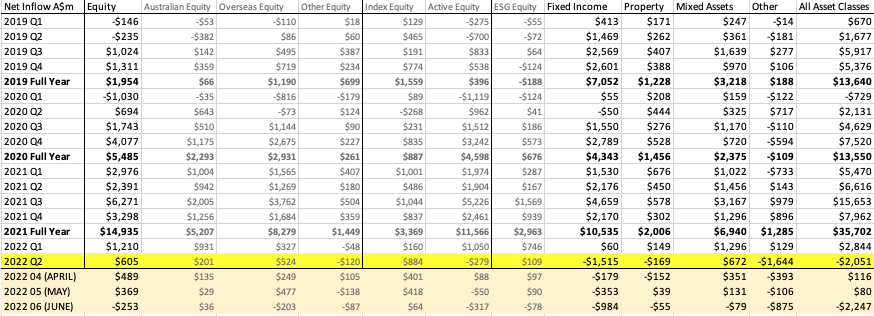
Across all asset classes, Australian investors withdrew A$2.05 billion from managed funds in the second quarter, the worst quarterly figure since at least 2019, when Calastone’s Fund Flow Index record began. Unlike investors in other parts of the world, Australians have also turned negative on property funds. They withdrew A$169m in the second quarter, the first negative quarterly reading on Calastone’s Fund Flow Index record.
Teresa Walker, Managing Director of Australia and New Zealand at Calastone said, “Signs of optimism are scarce as the global bear market shreds investor sentiment. June was the first time we have seen investors withdraw capital from every equity category (except Australian) and every asset class.
“The relative resilience of Australian equities reflects the commodity and banking bias on the market. The Australian stock market is one of the highest yielding in the world and that has proven a big draw in times of rising inflation and interest rates. Nevertheless, even appetite for Australian equity funds waned substantially in May and June. As fears of a global recession have grown, equities everywhere have seen a further convulsion of risk aversion. Commodity prices have fallen sharply too and that takes the shine off the Australian market even for domestic investors.
“Outflows from infrastructure funds and property are harder to explain. Infrastructure investments often come with inflation protection built into long-term contracts, making them attractive in today’s environment. Property is an asset-backed income investment that also has some defensive characteristics. Property is, of course, not immune. Capital values are sensitive to rising interest rates and a severe recession would inevitably lead to stress among tenants in more cyclically exposed segments like retail or offices, in contrast to more stable segments like healthcare. Finding funds with the right mix of holdings, particularly those with desirable properties that have pricing power, is therefore an important consideration for investors.”
Spotlight on Fixed Income – dramatic outflows from bond funds
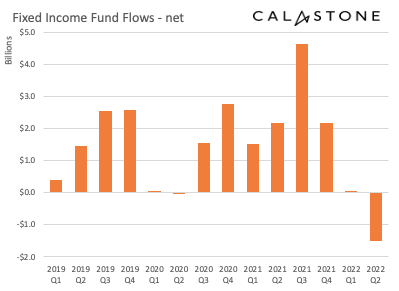
Fixed income funds in particular are out of favour. What began as a trickle in March accelerated each month to reach a flood by June, marking the first time on Calastone’s Fund Flow Index record investors had withdrawn capital from fixed income funds for four consecutive months. Net outflows totalled A$1.52 billion in the second quarter, of which A$984 million was in June alone. The outflows were driven by a sharp increase in selling activity (rather than a simple buyers’ strike) as investors actively fled the asset class – the level of purchases remained roughly flat compared to Q1. Calastone’s Fund Flow Index (FFI): Bonds fell to 43.8 in Q2, the lowest on Calastone’s Fund Flow Index record, meaning that the value of sell orders were 1.3x higher than buy orders.
Figure 2: Calastone net fixed income fund flows, all AU domiciled

Australia’s investors are not alone. Calastone’s recent analysis of global fund flows showed similar behaviour among those elsewhere, with Europeans and investors in the UK and across the rest of Asia also turning negative on fixed income. Investors everywhere, including in Australia, have been more negative on higher risk categories of bonds like high yield sovereign or corporate bonds.
Ms Walker added, “June’s outflow from fixed income funds was second only to March 2020, when bond markets globally convulsed as lockdowns descended worldwide. Central banks rode instantly to the rescue by pumping huge quantities of liquidity into the system. No such help is available today. Indeed, central banks, including the RBA, are tightening policy rapidly in a belated attempt to squeeze out inflation, deliberately leaving bond markets to transmit tighter policy through the economy. We are witnessing a normalisation of monetary policy after over a decade of sedative quantitative easing. Greater differentiation between risky and low risk bonds and between the long and short end of the yield curve is healthy, but the adjustment process that is bringing it about is a painful one.”
Figure 3: AU domiciled Fund Flow Data recorded across the Calastone Network

Methodology
Calastone analysed over half a million buy and sell orders every month from January 2019, tracking capital from advisers, platforms and as it flows into and out of managed funds. Data is collected until the close of business on the last day of each month. A single order is usually the aggregated value of a number of trades from underlying investors passed for example from a platform via Calastone to the fund manager. In reality therefore, the index is analysing the impact of many millions of investor decisions each month.
More than 95% of Australian managed fund flows pass across the Calastone network each month. All these trades are included in the FFI. To avoid double-counting, however, the team has excluded deals that represent transactions where funds of funds are buying those funds that comprise the portfolio.
The index is a measure of investor conviction, placing the net flow of capital into the context of overall trading volumes. It also allows the reader to compare flows in asset classes of different sizes – A$100m of inflows may be very large for a small, relatively new asset class like ESG equity but very small for a huge category like fixed income. A reading of 50 indicates that new money investors put into funds equals the value of redemptions (or sales) from funds. A reading of 100 would mean all activity was buying; a reading of 0 would mean all activity was selling. In other words, $1m of net inflows will score more highly if there is no selling activity, than it would if $1m was merely a small difference between a large amount of buying and a similarly large amount of selling.
Calastone’s FFI considers transactions only by Australia-based investors, placing orders for funds domiciled in Australia. The majority of this capital is advised, via platforms.


